Flow map
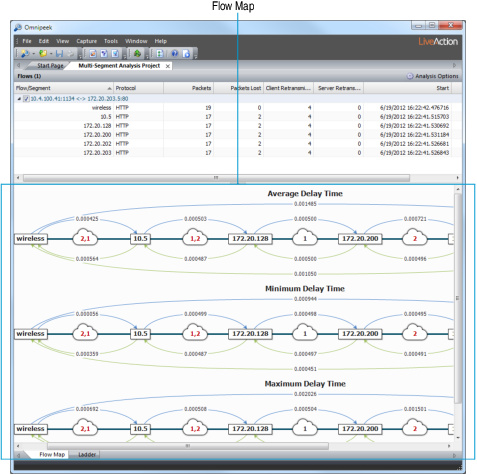
The flow map displays a graphical representation of the segments of the selected flow. Each segment in the flow is displayed from end-to-end (client on the left and the server on the right), along with timing statistics (average delay, minimum delay, and maximum delay) between each segment. Additionally, the hop count between each segment is also displayed (the little number inside the cloud between the segments).
Flow map viewing tips
Here are some useful tips when viewing the data inside the flow map:
• Hover over segments names and clouds to view tooltips displaying more data.
• Press the Ctrl key and use your scroll wheel (Ctrl+Wheel) to change segment widths.
• Arrows show the direction in which data flows.
• The client and server arrows use the same colors as from Client/Server Colors (on the menu, click , and then click ).
• The number in the clouds are hop counts, as determined by the Time to Live (TTL) values within the packets. If there is one number in the cloud, then both the client and server hops are the same. If there are two numbers in the cloud, then the client and server hops are different, indicating that the client and server paths are different. If there are multiple paths in one direction, no hop count is displayed for this direction. Hop counts greater than one are displayed in red. The TTL of each packet can be displayed in the Ladder diagram.